This fall, when students may be attending class in-person some days and completely online for others, it may be more challenging to notice disengaged behaviors and take actions to intervene before missed classes and failed assignments lead to students failing or dropping classes.
In this article, we’ll look at the tools in Canvas and Zoom that can give you some insights into student engagement and metrics. These may also be helpful in developing attendance and participation policies, but more importantly, they may help you identify disengaged students sooner than later. Page links will open in a new window to make it easier to both read and follow the steps.
Attendance and Lecture Content
It’s hard to succeed if you don’t show up for class. Consequently, many courses feature strict attendance policies to underscore how critical being present is and to encourage students to prioritize attendance.
Being in class usually means students are interacting with their instructor, lecture content, and oftentimes, with each other during small-group activities.
With in-person students, attendance and participation can be assessed as it has in the past for the most part. However, passing around a sign-in sheet is not recommended. For online synchronous and asynchronous students, Zoom tools make it easier to know which students have attended a synchronous class session and which students have watched a recorded session. To make use of these tools, you will need to require registration to your Zoom room and record your class session to the cloud, not your computer.
Set up to record to the cloud and require registration
- Log into Zoom
- Click on “Meetings” > Schedule a New Meeting
- Check “Required” next to registration
- Consider checking “Record the meeting automatically” to make sure you don’t when class starts. Either way, you will be prompted to choose whether to record to the cloud or your own computer. Choose “In the cloud”.
Who attended the live Zoom session?
To find the list of students who attended the live Zoom session, take the following steps:
- Log into Zoom
- Click on “Reports”
- Click on the meeting room for which you want to get attendance
- Choose “Registration Report” and search for the specific session by date
- Click “Generate” on the right side of the session.
- Choose “All registrants” and click “Continue”
Who played the recorded session?
Unless you need to provide professionally captioned recordings to meet accommodation needs, the easiest way to know which students watched the recording of the class session, is to make the recording “On-Demand” in Zoom.
- Log into Zoom
- “Recordings” >“Cloud Recordings”
- Click the “Share” button to the right of the recorded class session
- Turn on “On-demand” (Registration Required)
- Then “Copy sharing information to clipboard” to get the information to paste into a page or announcement in your Canvas course so students may access the recording.
To see the viewing report...
- Log into Zoom
- Click on the name of the on-demand recording
- Click on “View Registrants” to see which students played the recording and for how long
Consider setting a deadline by which students who did not attend class synchronously, whether in person or remotely, must watch the recording. This will make it easier to check and grade attendance and help keep asynchronous students on track and in sync with students attending synchronously.
Prior Knowledge Check
One technique for piquing students' interest or to stimulate their relevant prior knowledge before providing lecture content is to ask them a compelling question before beginning the presentation. This technique can also be incorporated into the recorded sessions by creating a custom question as part of the on-demand registration process.
- Log into https://unl.zoom.us
- Click on the name of the on-demand recording
- Click on “Registration Settings” > “Custom Questions”
Interacting with Course Content, Instructors, and Each Other in Canvas
While many classes have textbooks and other materials students use offline, many courses have provided an increasing amount of course content and interaction through the Canvas shell. With the move to flexible hybrid learning, this increase will accelerate. These types of analytics data could be used as part of a participation grade and may help encourage students to interact with content on a regular basis instead of procrastinating. Many things can be learned and done with New Analytics. A short list is below:
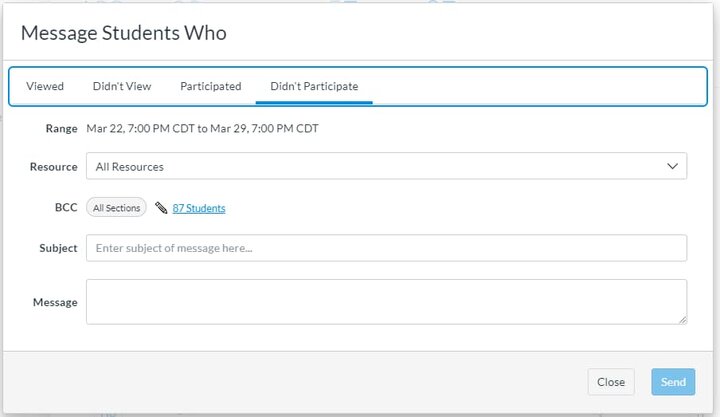
- Which students viewed pages? Students without any views didn't log into the course that week. Depending on the number of assignments due and resources stored in Canvas, this may be cause for alarm. They may have disengaged or have had some unanticipated problem. Either way, it may be appropriate to use MyPLAN to let their advisor know they haven't shown any activity in the course shell or you may want to message those students and let them know you noticed their absence. You may want to let those students who viewed pages also know that you noticed by messaging them and asking if they have any questions about the content they viewed.
- Which course pages and resources have the most and least views? Although main pages such as the home page and modules page are always going to have the most views, the number of views on other pages may help you learn what your students are most curious or anxious about. You may also discover that resources you spend a lot of time developing are not used very much and may not merit that level of investment. You might even discover that message board posts or announcements with images or videos are more often viewed than those without or some other pattern of behavior that changes the way you design your course or communicate content.
- Have students previewed assignments or content? If you wonder why students aren't asking questions about assignments or content, it may be that they haven't even looked ahead to see what will be expected and you may want to give them a nudge to do so, especially if completing the assignment or project will take some planning. Knowing if students have previewed course content before class may also impact how you carry out in-class activities.
- Give customized interactions based on grades and other assignment metrics. In a large enrollment course, it may be useful to give feedback to students based on a grade range. For example, you might supply additional study resources or pointers to previously covered content only to those scoring less than 70% on a recent exam. Or, perhaps you want to let students who have not yet turned in an assignment that you will give them partial credit if they can complete it within two days.
- Helping students take responsibility for their learning using hard data. Students who are doing poorly in a course do not always understand why and looking at their usage patterns of the Canvas shell and other resources can provide the hard data that may initiate change. For example, New Analytics would allow you or an advisor to say something along the lines of "I noticed you only log into the course during weeks in which we have exams..." or "You didn't view the tutorial pages I prepared on those topics."
New Analytics is not turned on for courses by default. To watch a video overview of features, view New Analytics Canvas Community page. To activate New Analytics for your course, take these steps:
Log into your course on Canvas
- Click “Settings” in the navigation
- Click the “Feature Options” tab at the top of the settings window
- Activate “New Course and User Analytics”
With respect to course engagement, two uses of New Analytics seem especially apt: page views and participations.
Who is viewing content and participating in discussions on Canvas?
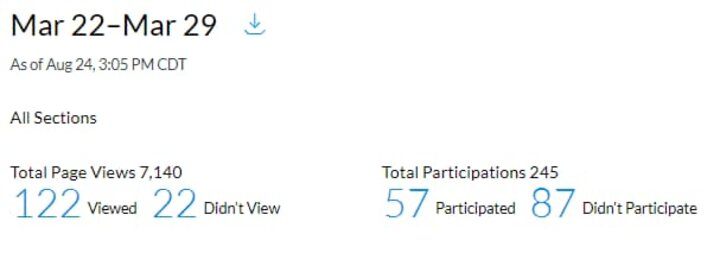
Using weekly page view data allows instructors to identify and message students who haven’t viewed any pages or logged any participations for a particular week.

Participations include, but are not limited to, posting to Canvas discussions, replying to instructor announcements, submitting assignments, and taking quizzes. Like page views, instructors may identify students with no participations for a specific week and send them a message.
Looking at these analytics may also provide clues to how students are feeling about the class. For example, while more page views are generally considered a positive thing, unusually high numbers of page views may represent anxious students who may not understand course organization or expectations.

To make the most use of Canvas analytics, consider implementing naming conventions for key content or assignment elements. Doing so can make it easier to see which students are previewing materials needed for the next class session or have looked at the assignment that is due in the coming week.
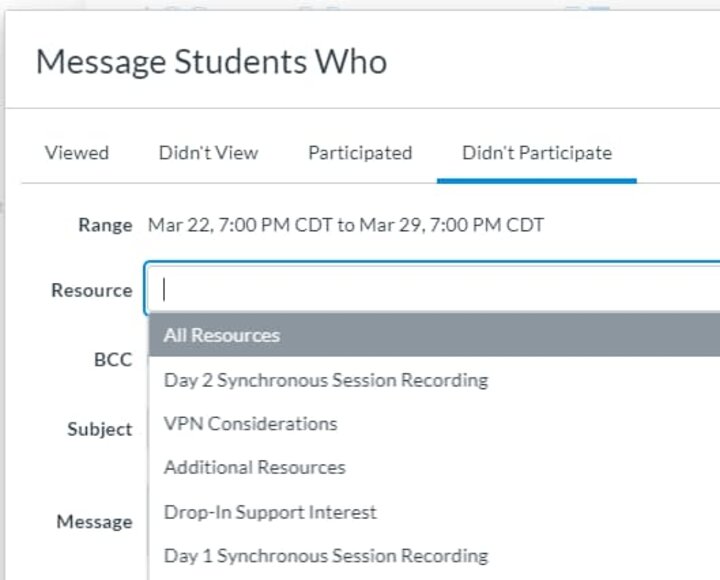
All components in Canvas from pages, to discussions, to assignments are considered “Resources” and in some menus and listings in the analytics area the resources are not differentiated by type. This can make it quite difficult to message students who haven’t viewed a specific page or participated in a specific discussion.
A way to increase the utility of New Analytics is to implement a naming convention that makes it easier to remember which resource is what. E.g. W3-D: Common examples of poor interface design and their implications. The “W3” keep track of which week and the “-D” denotes discussion. If this convention were used, the instructor could quickly check the analytics on this particular activity and send a reminder to students who had yet to participate.

Social Engagement with Yellowdig
Yellowdig is a social learning platform designed to support student engagement in discussions around content relevant to your course. This platform allows students to share videos, articles, and other web-based content. The configurable grading supports instructor creation of automatic grading based on the number of words in pins and comments, likes, instructor badges, and even allows you to require students to participate consistently over the entire semester. Note: Yellowdig analytics are not tracked in Canvas New Analytics, but the LTI tool has its own built-in system of tracking that is integrated with the grading options.
Follow these directions for setting up Yellowdig in your course and consider joining other UNL faculty in discussions about social engagement and their experiences with Yellowdig by contacting Tawnya Means at tawnya.means@unl.edu and asking to join the Social Engagement Teaching Fellows group for Fall 2020.
Engagement and MyPlan
Like in-class attendees, students attending synchronously or asynchronously, may or may not be paying attention and engaging in the learning experience even though they clicked and opened a page, or opened a video and played it. However, like attending class and opening the textbook, clicking on links and opening pages and playing videos is the first step towards learning from them. Consequently, if you discover students who are not logging into lectures or spending much time in the Canvas shell with course content, consider messaging them as well as noting their disengaged behaviors in MyPLAN, the UNL system connecting students with their advisors and instructors. Taking this action helps initiate a system of support for student success. Consider also noting engaged behaviors in MyPLAN. To access MyPLAN, click on the link in the left navigation of the Canvas course shell.